tiler
Tiler - Use Case
How can tiling help in mapping applications?
Perimeter tiling helps demarking areas needed for geo-business applications or for response management operations before or during disaster events such as fires, floods or a dam collapse / overflooding. A tiled perimeter is better than the conventional area partitioning that depends on county boundaries or other non-symateric method and that does't cover same size areas. This anomaility makes some perimeters significantly bigger when compared to others which may create false alarms to far areas and undermine an efficient distribution of response teams and equipment. The use of tiled perimeters has the following benfits:
- Damarking areas that are made by joining similiar size tiles using a shorthanded, unified, easy to understand and traceable numeric representation
- Enabling the use of matrices that are any combination of tiles accordingly with a resolution (granularity) level.
- Ability to digitize/pixelize polygon areas accordingly with a adaptable resolution (granularity) and creating dynamic perimeters
- Overcoming the need of cumbersome calculations and high memory use needed when superimposing polygons, grids or tiles on maps.
- Assigning properties or colors to tiles which enable easier understaning and proximity evaluation to businesses, response teams and affected persons enabling a overview of contextualized maps
Use Case - Eaton Fire
Objective
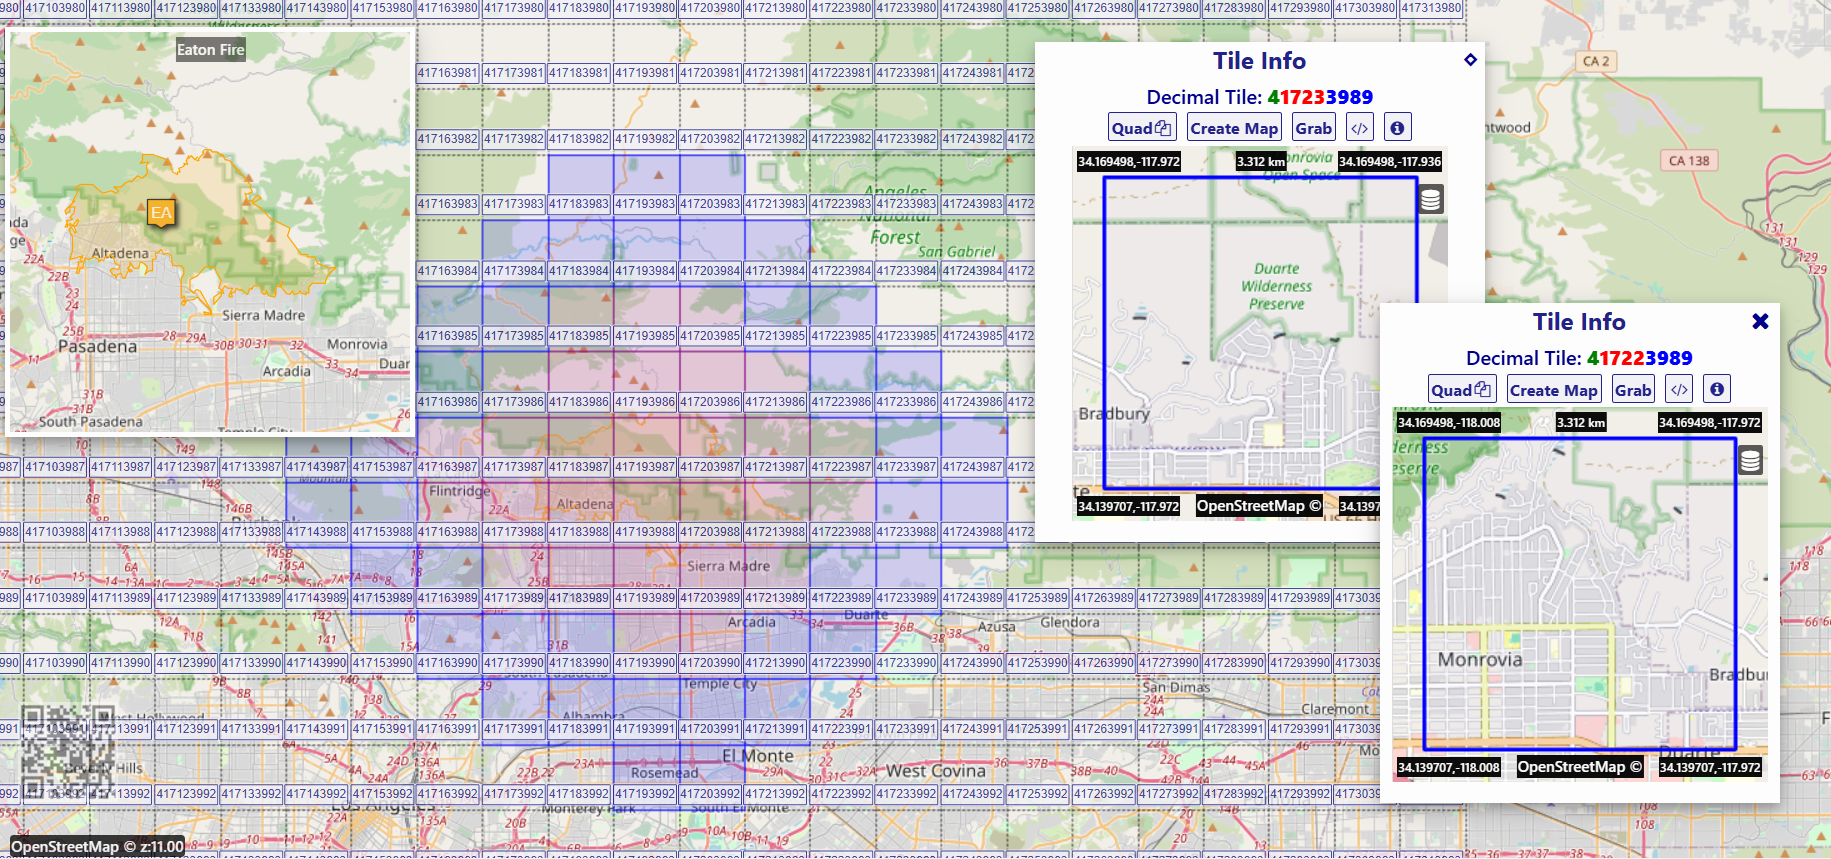
Depicting an imaginary impact/evacuation area and a larger smoke effect perimeter by showing grids with similar sized tiles that surround the area that went under fire.
Raw sources
A geoJSON map delimits the area of the “Eaton Fire” that took place in California and engulfed about 14,000 acres. The map is available at https://gis.data.cnra.ca.gov/
A corresponding geoJSON file can be suppoerimposed on a mapping application firiseaton.geojson or firiseaton
Methodology
- Extract polygons from the geoJSON file
- For each polygon do:
- Create a list of all enclosed tiles which are inside the polygon (perimeter #0)
- For each vertice check what tile encloses that vertice
- Filter repetitive tiles - create a border list of tiles (Perimeter #1)
- Create a perimeter with threshold 1 by finding all tiles that are adjacent to the border tiles and are not part of the enclosed tiles (pereimeter #2 and so on)
- If the perimeter threshold is bigger than 1 find the adjacent tiles to the threshold 1 and make threshold 2... and so on
- Merge the tile perimeters by removing tiles that are in higher perimeters if they are part of the lower perimeter and fileter repetitions
- Assign property to each perimeter such as a status, propeterty and/or color or a callback function
- Create the geoJSON export file by retrieving the coordinates of the tiles and assiging the properties
Solution
The algorithm uses the tiler API to generate a list of tiles that make up the corresponding perimeters which are exported to a cross platform geoJSON output. The file can be superimposed on a map application which may enable a web service that calcuates the distance to an evacuation area or a smoke impact area. If a higher resolution is needed the granularity level can be increased. Perimter thresholds, coloring and naming can be increased as well.
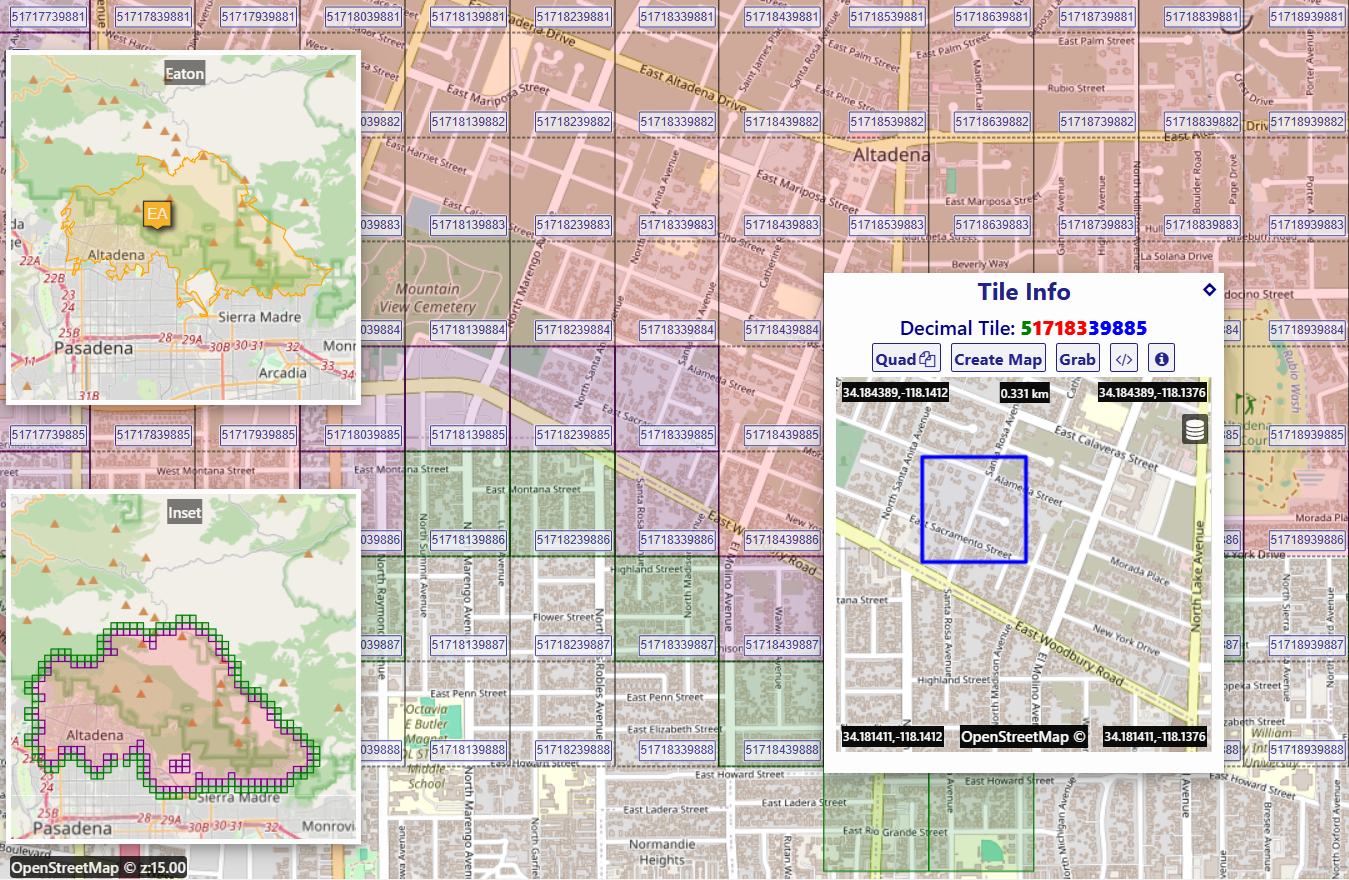
Changing granularity for different applications
In another scenario a higher granularity can show the fire bordering tiles which may serve for the purpose of locating access routes, hospitals or assigning resposne teams to specific tiles.
Read more on the tiling Concept